信息网络安全 ›› 2016, Vol. 16 ›› Issue (10): 8-14.doi: 10.3969/j.issn.1671-1122.2016.10.002

• • 上一篇    下一篇

多视图合作的网络运行日志可视分析

王劲松1,2,3(), 黄静耘1,2,3, 张洪玮1,2,3, 南慧荣1,2,3   

  1. 1. 天津理工大学计算机与通信工程学院,天津 300384
    2. 天津市智能计算及软件新技术重点实验室,天津 300384
    3. 计算机病毒防治技术国家工程实验室,天津 300457
  • 收稿日期:2016-08-10 出版日期:2016-10-31 发布日期:2020-05-13
  • 作者简介:

    作者简介: 王劲松(1970—),男,天津,教授,博士,主要研究方向为信息安全、计算机网络;黄静耘(1992—),女,广东,硕士研究生,主要研究方向为网络安全与可视化;张洪玮(1990—),男,江苏,博士研究生,主要研究方向为网络安全;南慧荣(1992—),男,山西,硕士研究生,主要研究方向为网络安全。

  • 基金资助:
    国家自然科学基金[61272450];天津市科技支撑项目[14ZCZDGX00072]

Multiple View Cooperative Visual Analytics of Network Operation Log

Jinsong WANG1,2,3(), Jingyun HUANG1,2,3, Hongwei ZHANG1,2,3, Huirong NAN1,2,3   

  1. 1. School of Computer and Communication Engineering, Tianjin University of Technology, Tianjin 300384, China
    2. Tianjin Key Laboratory of Intelligence Computing and Novel Software Technology, Tianjin 300384, China
    3. National Engineering Laboratory for Computer Virus Prevention and Control Technology, Tianjin300457, China
  • Received:2016-08-10 Online:2016-10-31 Published:2020-05-13

摘要:

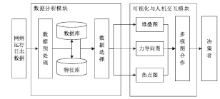
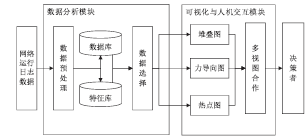
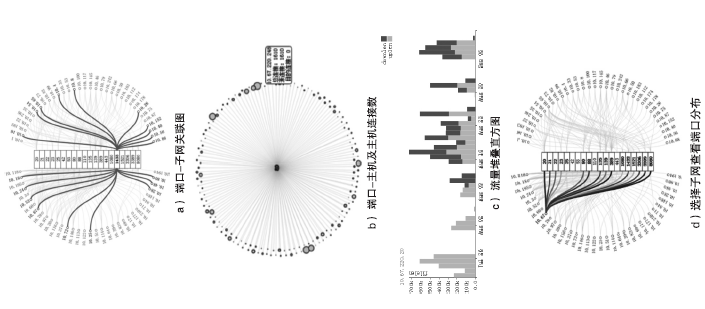
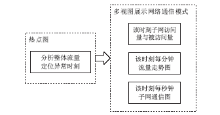
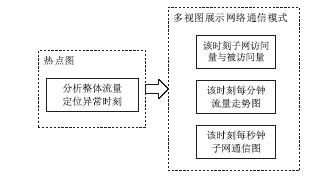
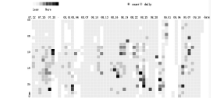
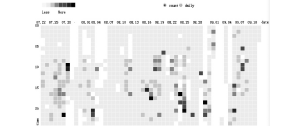
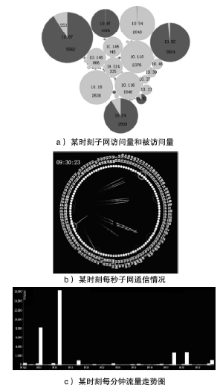
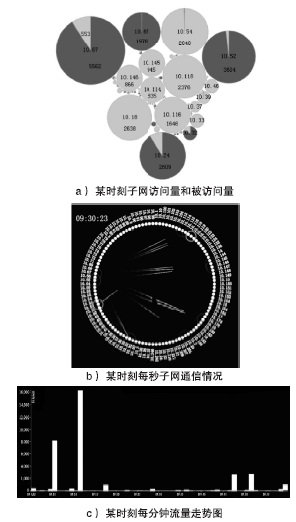
网络运行日志是网络管理人员掌握网络状态的主要信息来源,在对网络日志数据进行数据处理和特征分析之后,文章设计并实现了一个多视图合作的网络运行日志可视分析系统,将力导向图、堆叠图、热点图等多种协同交互、简单易用的可视视图引入网络安全可视化中,通过多视图合作方法实现对同一数据的多角度建模,从而帮助网络管理人员了解整个网络结构和网络运行特征。该系统包括两个模块,模块一从端口、连接和流量3个维度分析网络结构,进而区分网络的客户端和服务器;模块二以网络的整体流量状况作为切入口分析整个网络的异常情况,并从每小时、每分钟、每秒的维度对子网通信模式进行分析。

关键词: 网络可视化, 可视分析, 网络通信模式, 协同分析

Abstract:

Network operation log is the main source of information for network managers to master the state of the network. After dealing with the network operation data and according to the feature analysis, this paper presents a collaborative visual analyze system for network operation log, it provides multiple views with direct and rich interactions to modeling the data from different aspects. Force graph, stack graph and heat map are introduced to the visualization of network security. By collaborative visual analytics can help network administrators understand the structure of the whole network and the operating characteristics of the network. The system includes two modules. One is to analyze the network structure by three dimensions, port, connection and flow, and then distinguish the hosts between servers and clients. The other is to analyze the anomalies of the whole network by the overall flow situation, and then to find communication modes by time dimension.

Key words: network visualization, visualization analytics, network communication mode, collaborative analytics

中图分类号: